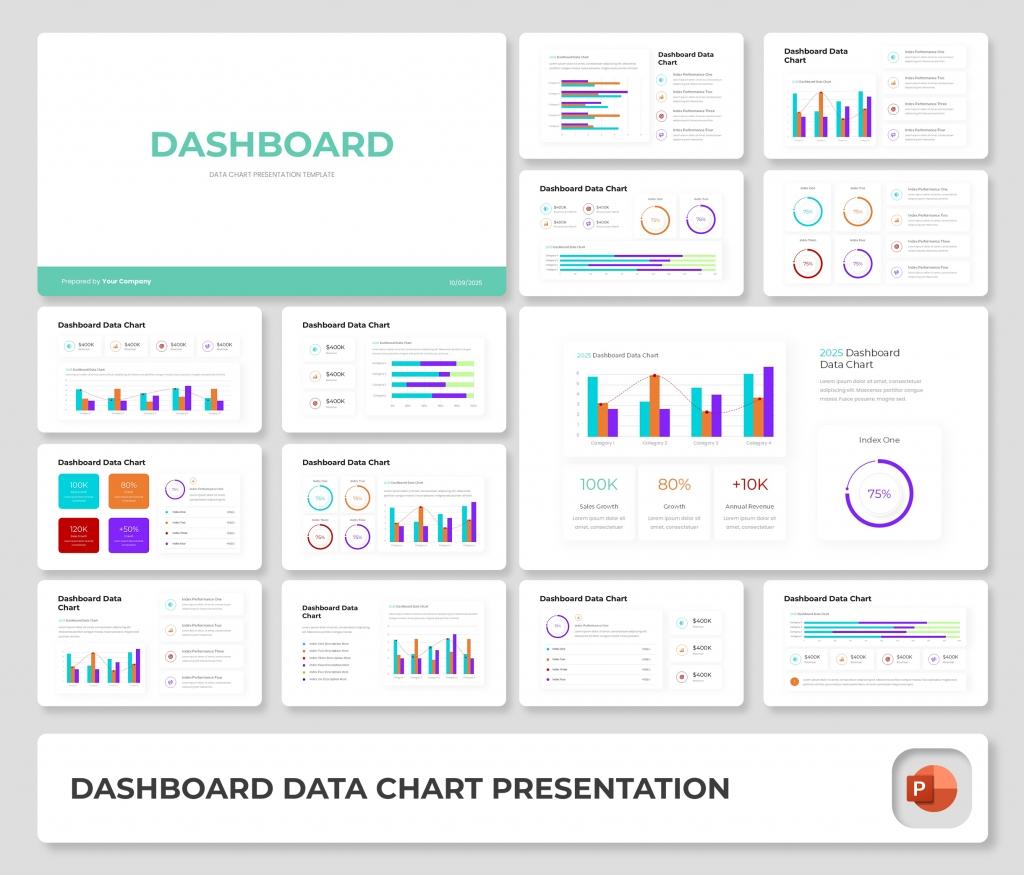
Dashboard Data Chart PowerPoint Presentation Template
In the world of business, data is king. But raw numbers can be overwhelming and difficult to interpret. The “DASHBOARD” Data Chart Presentation Template is engineered to solve this problem, allowing you to transform complex datasets into stunning, easy-to-understand visual stories. This template provides a clean, modern, and highly professional platform to present your key performance indicators (KPIs), metrics, and analytics. It’s designed to emulate the look and feel of a high-end business intelligence dashboard, making your data not just informative, but also visually engaging.
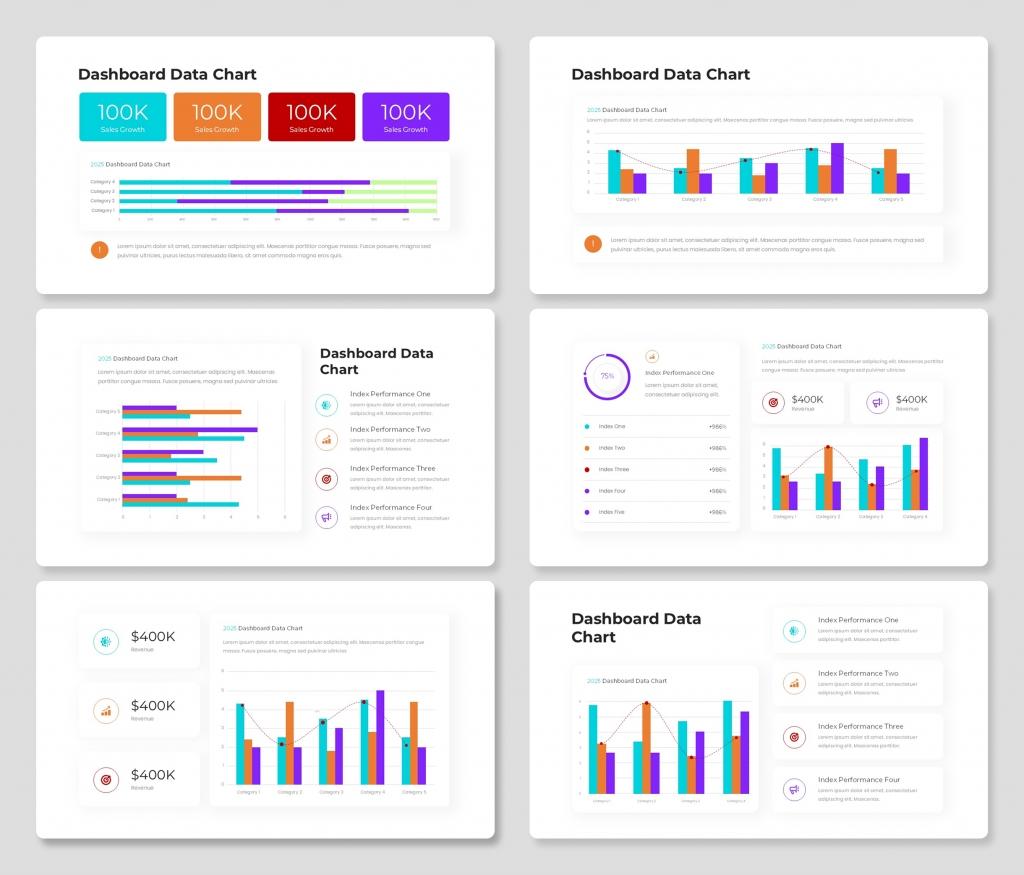
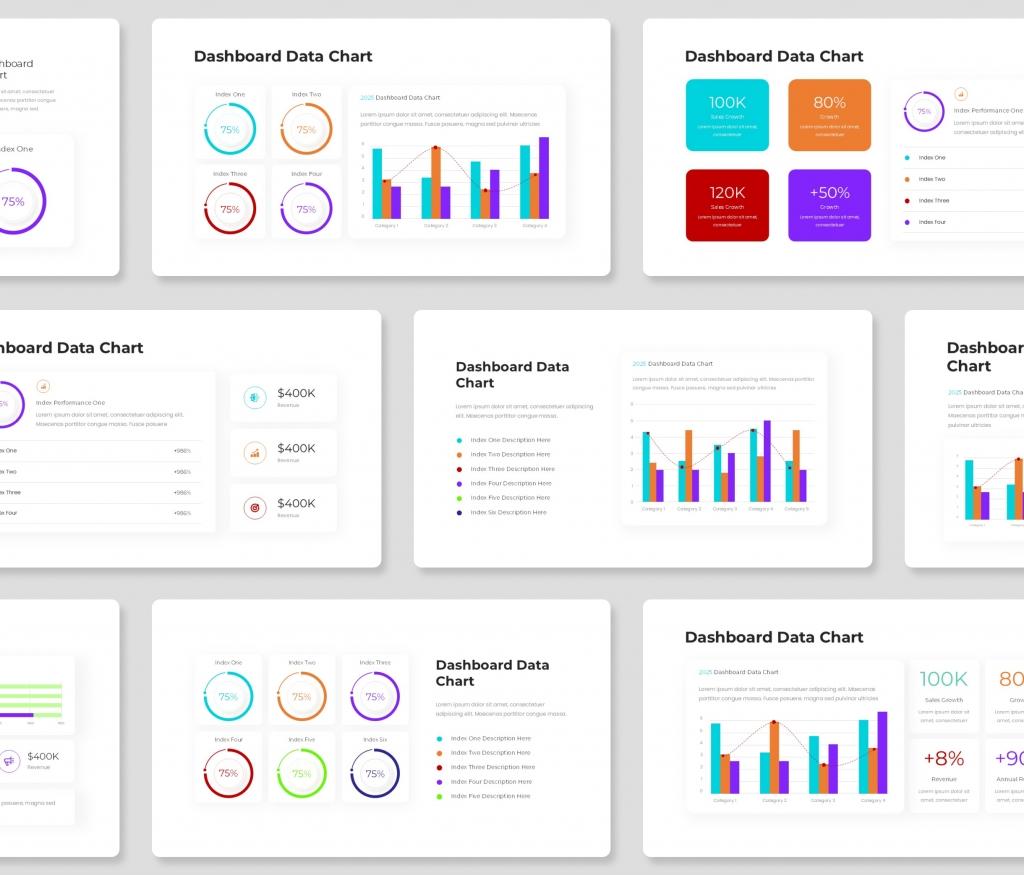
An essential tool for business analysts, project managers, marketers, and executives, the DASHBOARD template is perfect for performance reviews, financial reports, marketing analytics, and any presentation where data takes center stage. Use it to track progress, highlight trends, and provide clear, actionable insights to your team and stakeholders. Featuring a vibrant and professional color palette with a focus on teal and complementary colors, the design is minimalist and focused entirely on making your data shine. It comes packed with a wide variety of pre-designed charts, including bar graphs, donut charts, line charts, and stacked charts, all ready for your data. Built on master slides, every element is fully editable, allowing you to customize colors, fonts, and layouts to fit your brand perfectly.
Stop presenting boring spreadsheets. Whether you’re reporting on sales figures, tracking project milestones, or analyzing market trends, the DASHBOARD template provides the sophisticated framework you need to present your findings with authority, clarity, and visual impact.
FEATURES
- Total Slides: 20 Slides
- All graphics resizable and editable
- Used and recommended free web fonts
- Based on Master Slides
- 16:9 Wide Screen Ratio
- Picture Placeholder
Example of included content :
Executive Summary Dashboard | Key Performance Indicators (KPIs) | Sales Performance Metrics | Marketing Campaign ROI | Financial Health Overview | Project Status & Timeline | Customer Analytics Dashboard | Website Traffic & SEO Report | Social Media Engagement | Regional Sales Comparison | Product Performance Analysis | Team & Individual Performance | Budget vs. Actuals Chart | Monthly/Quarterly Growth Trends | Competitor Analysis Matrix | Market Share & Trends | Risk Management Dashboard | Future Forecasts & Projections | Key Insights & Data Summary | Action Plan & Next Steps
Want similar items? Get premium templates & graphics starting from just $1